
Read the market,
not just the candles.
Heatmap, footprint, CVD and 85 indicators on 900+ Hyperliquid and Binance markets, US stocks included. Free, no sign-up.
Start charting →No account needed to chart.

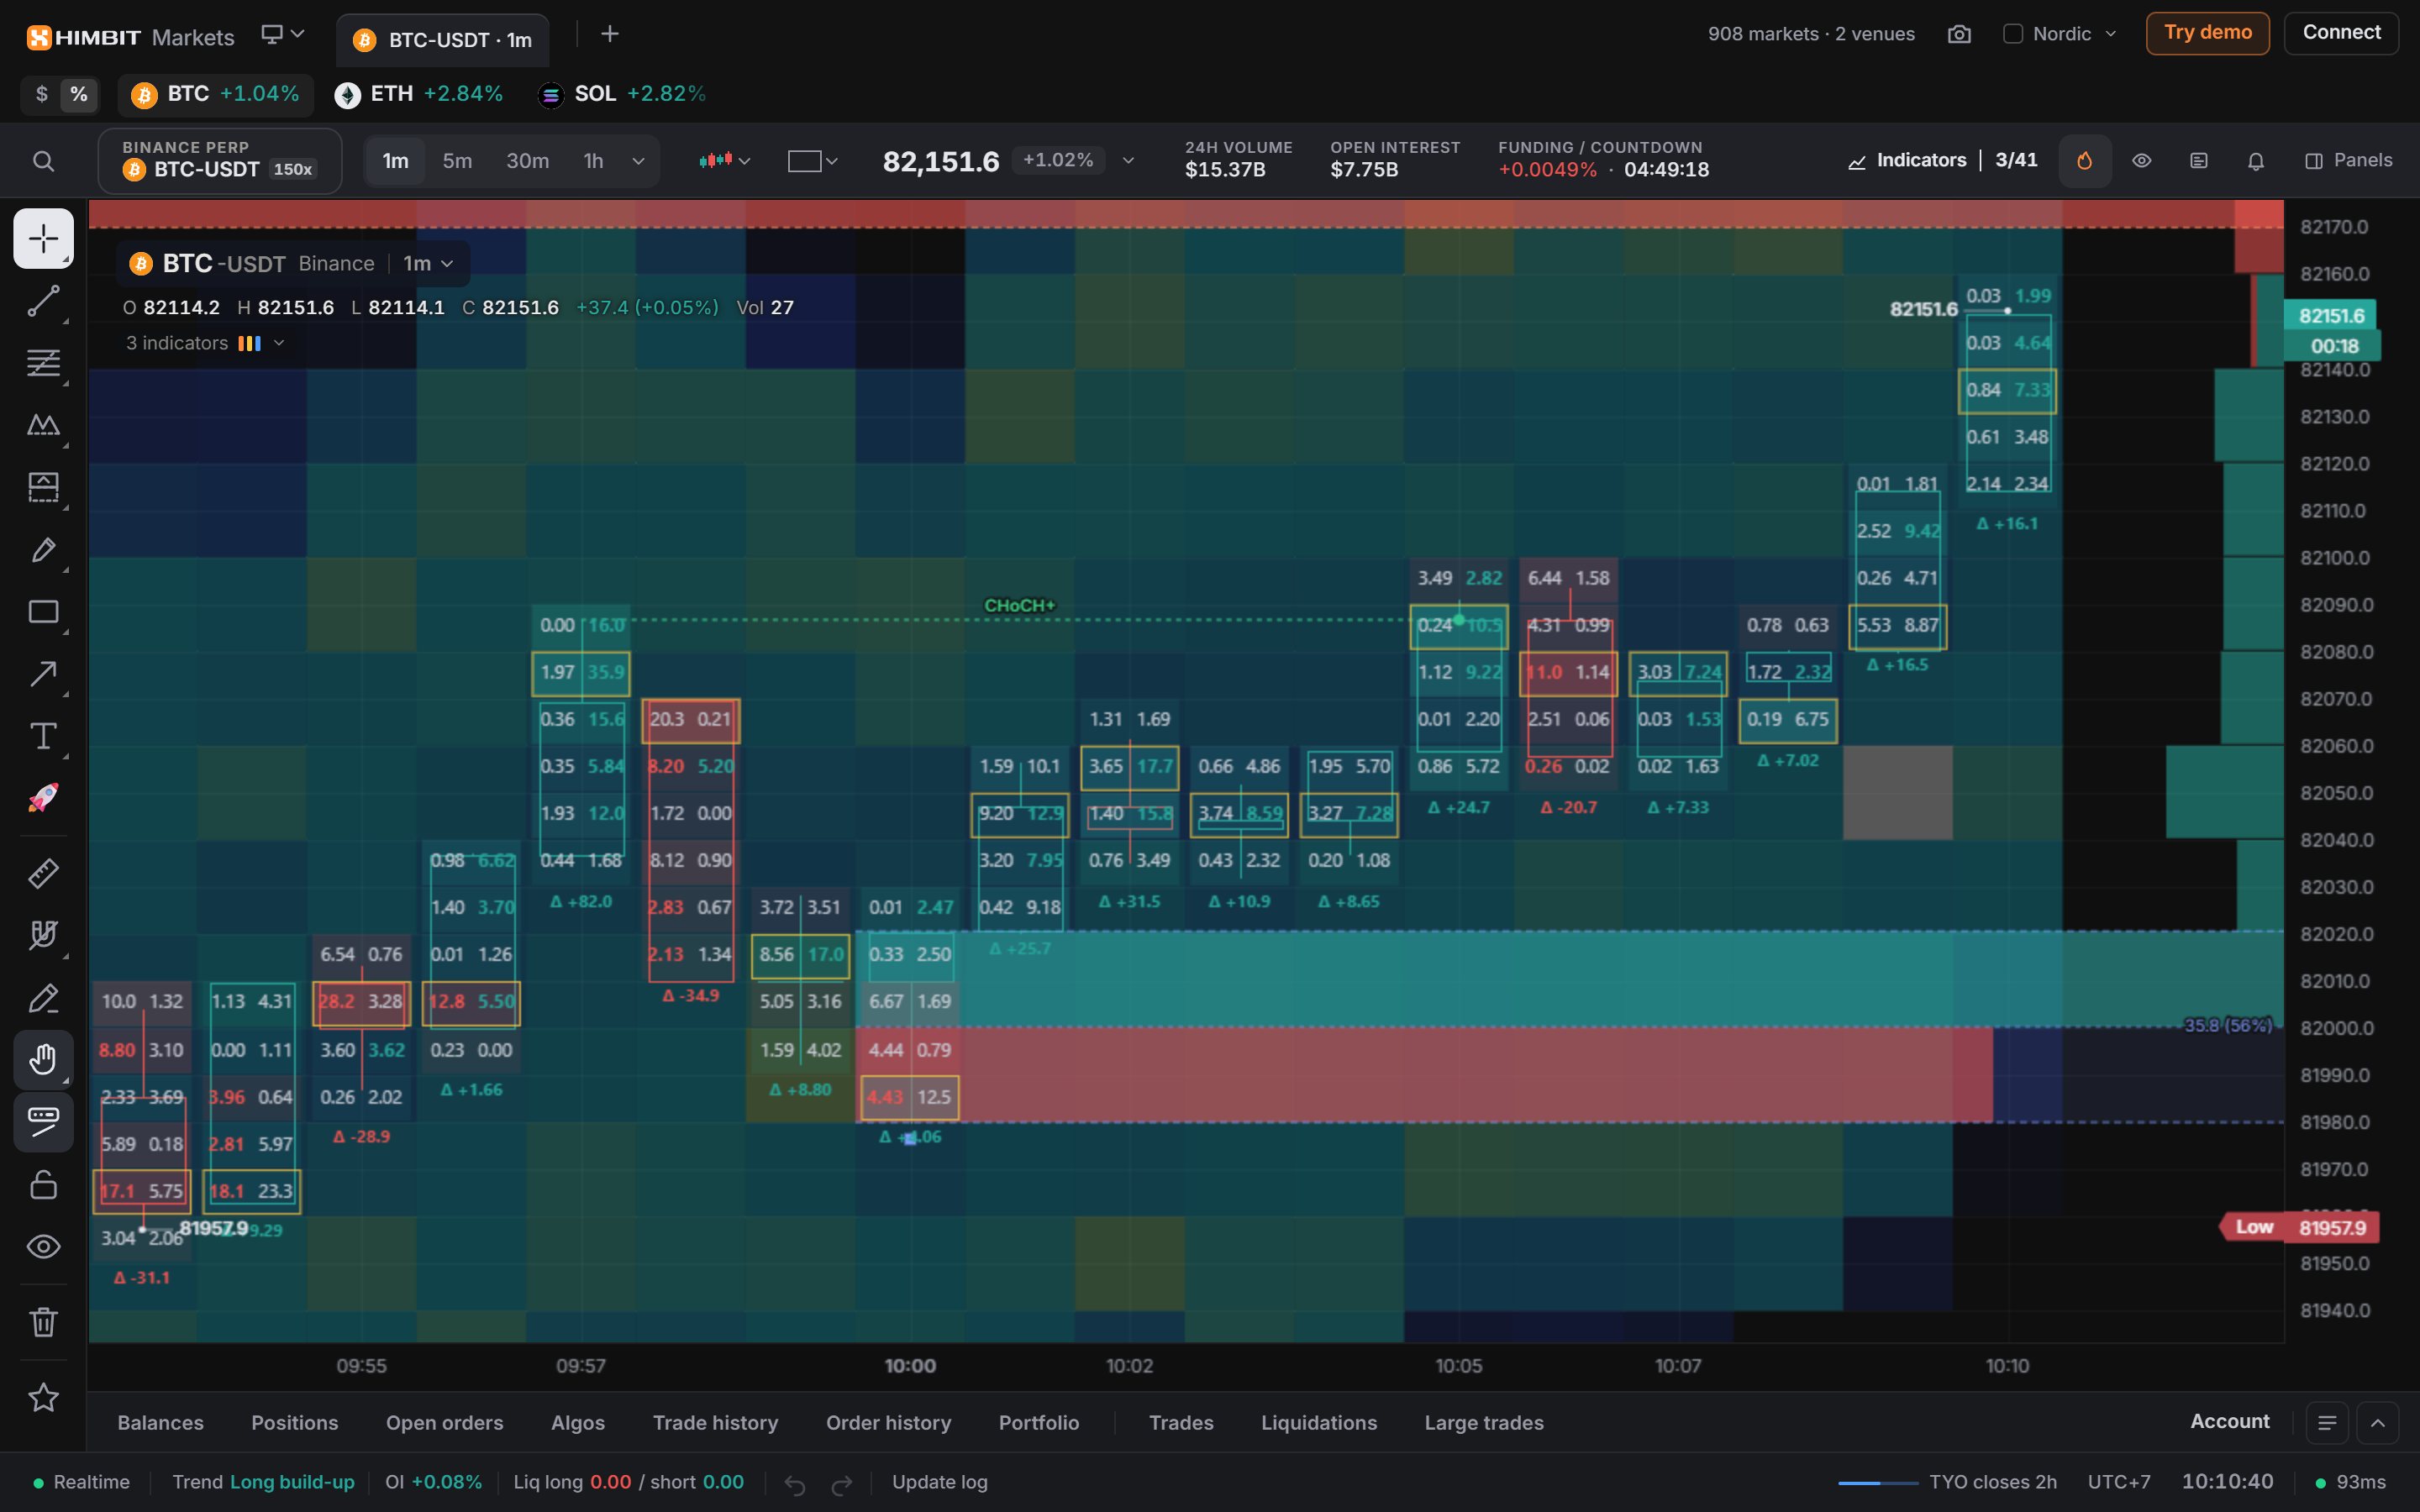
Most charts show you where price went. Market Open shows you who pushed it there: the resting orders, the aggressive fills and the structure they leave behind.
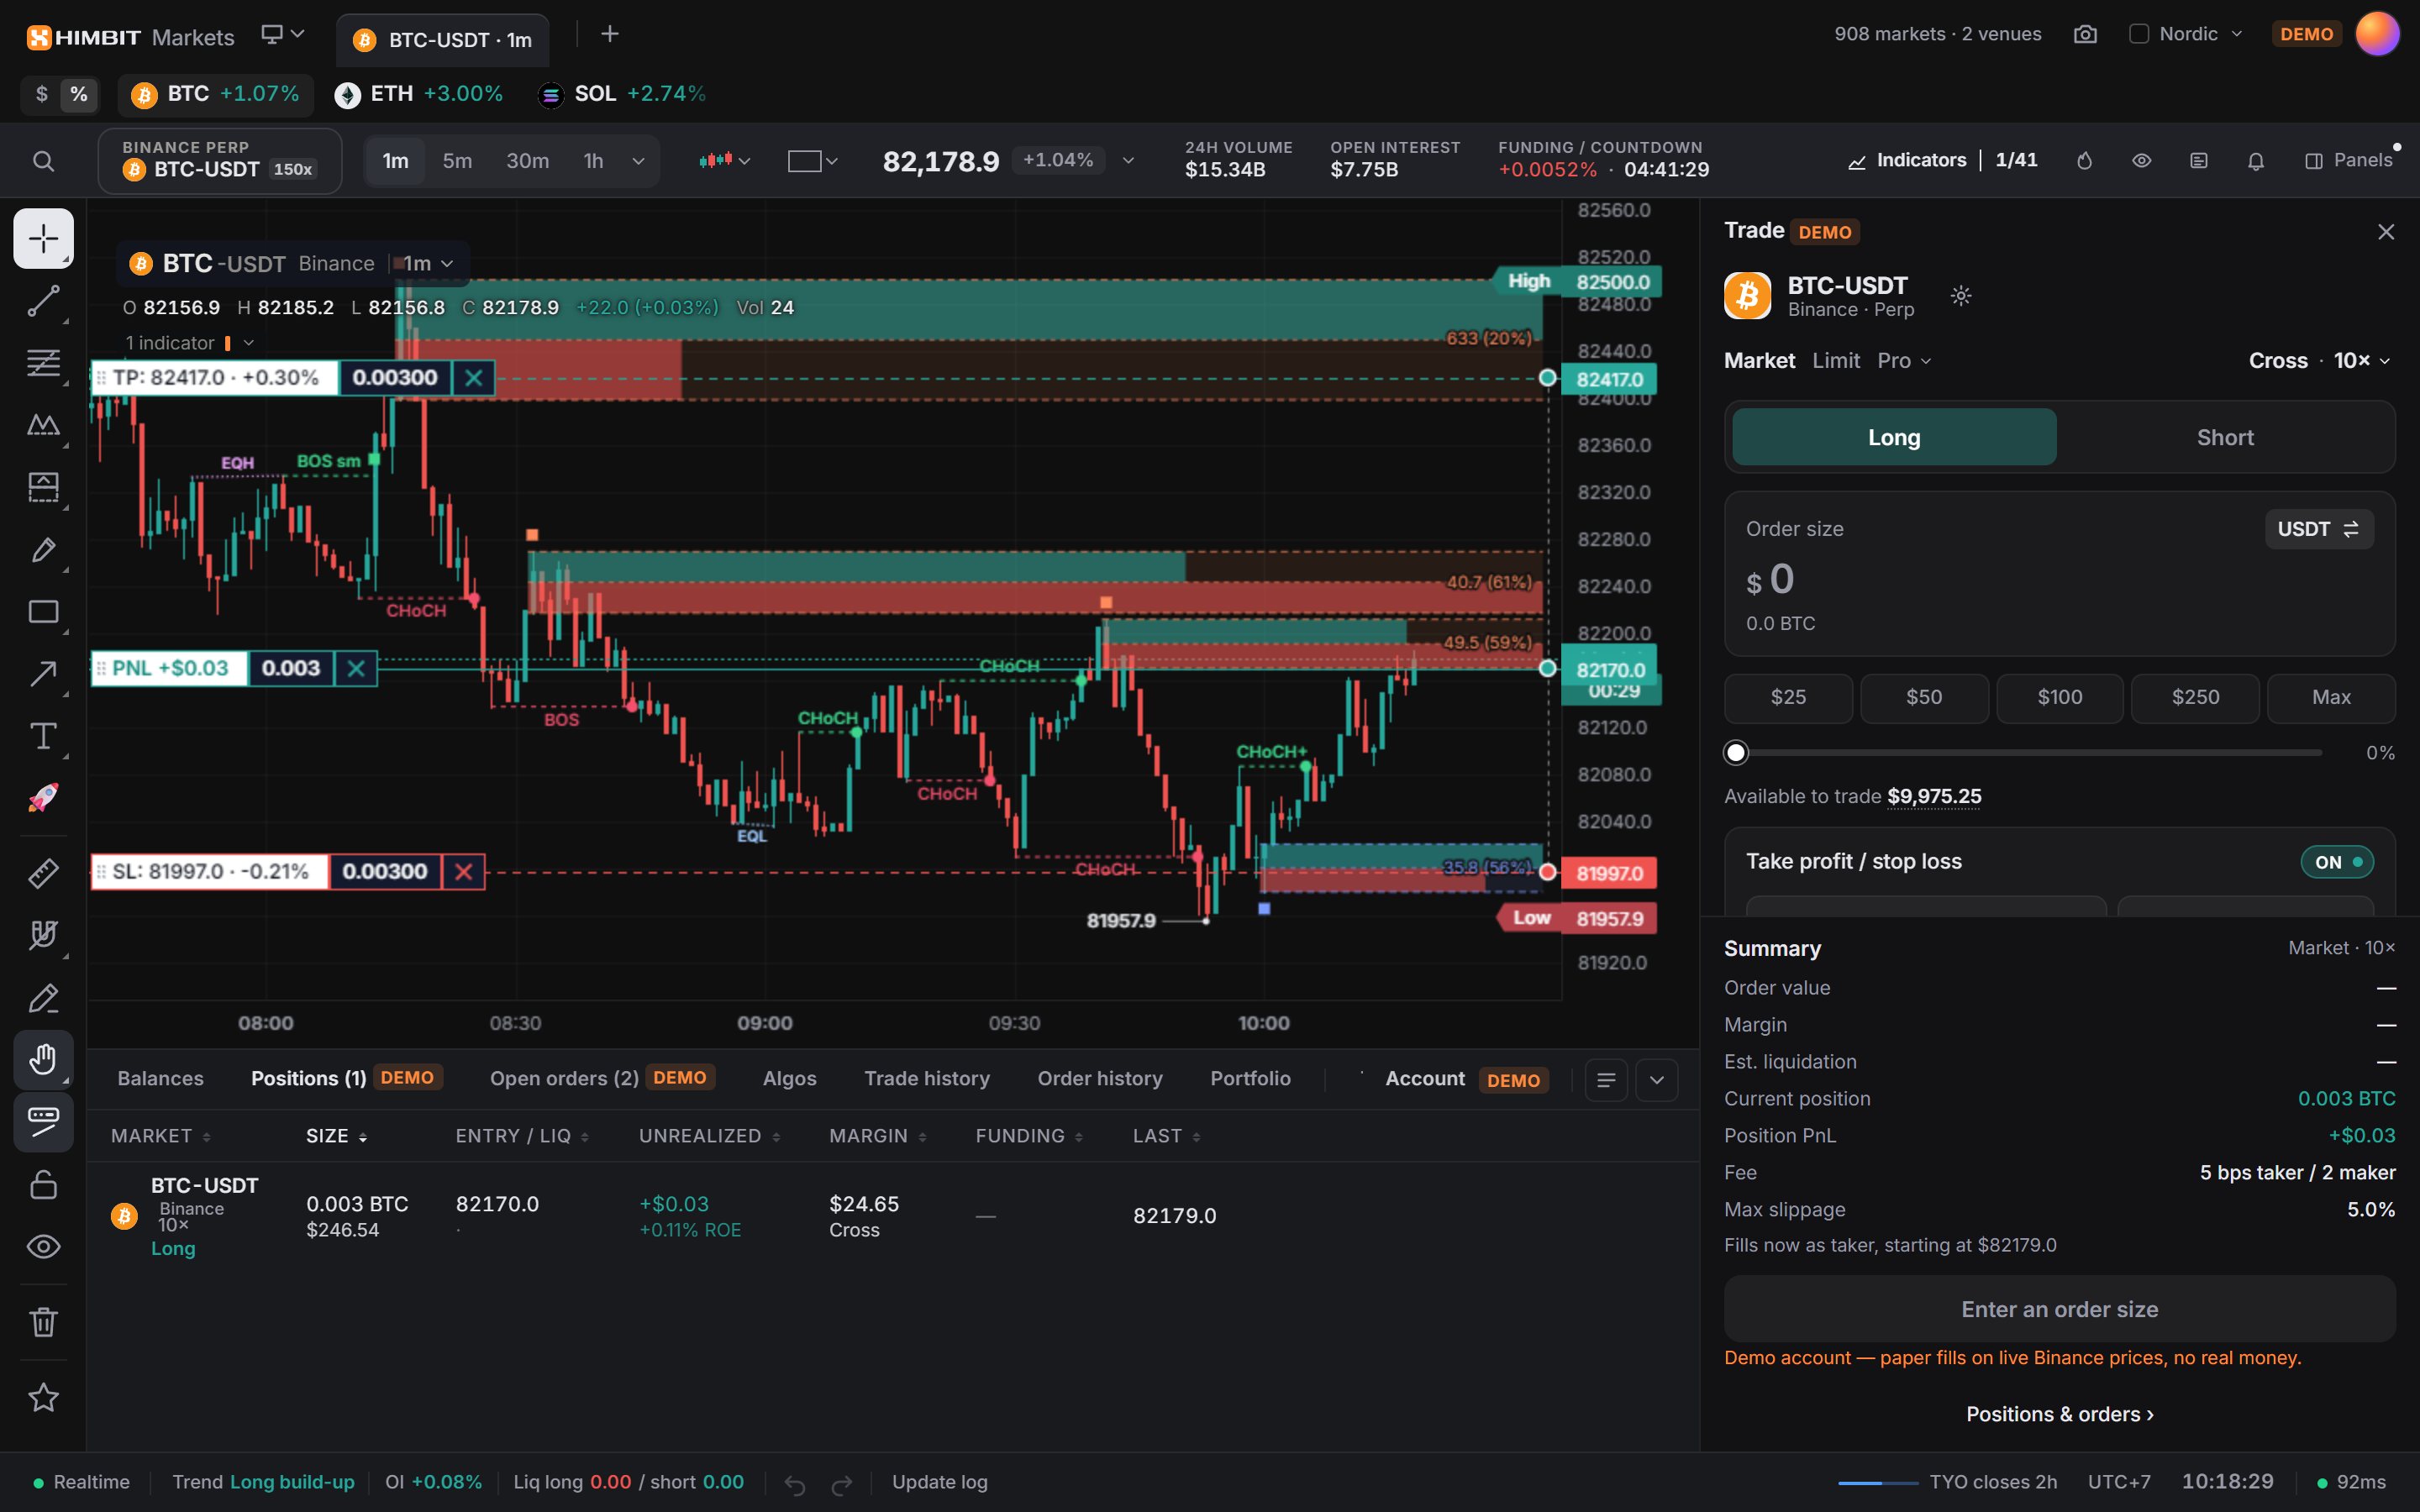
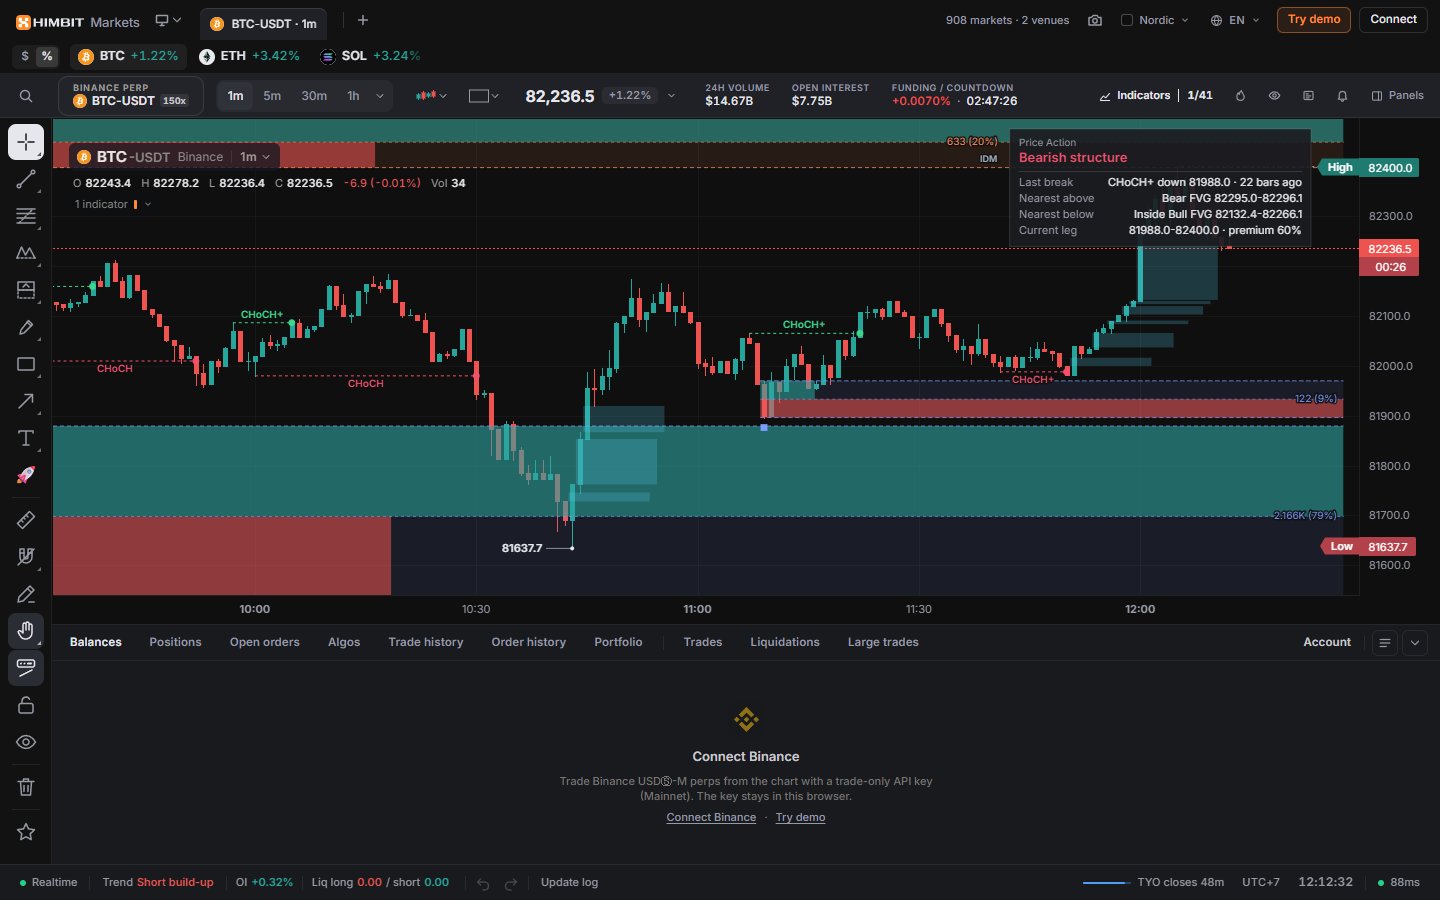
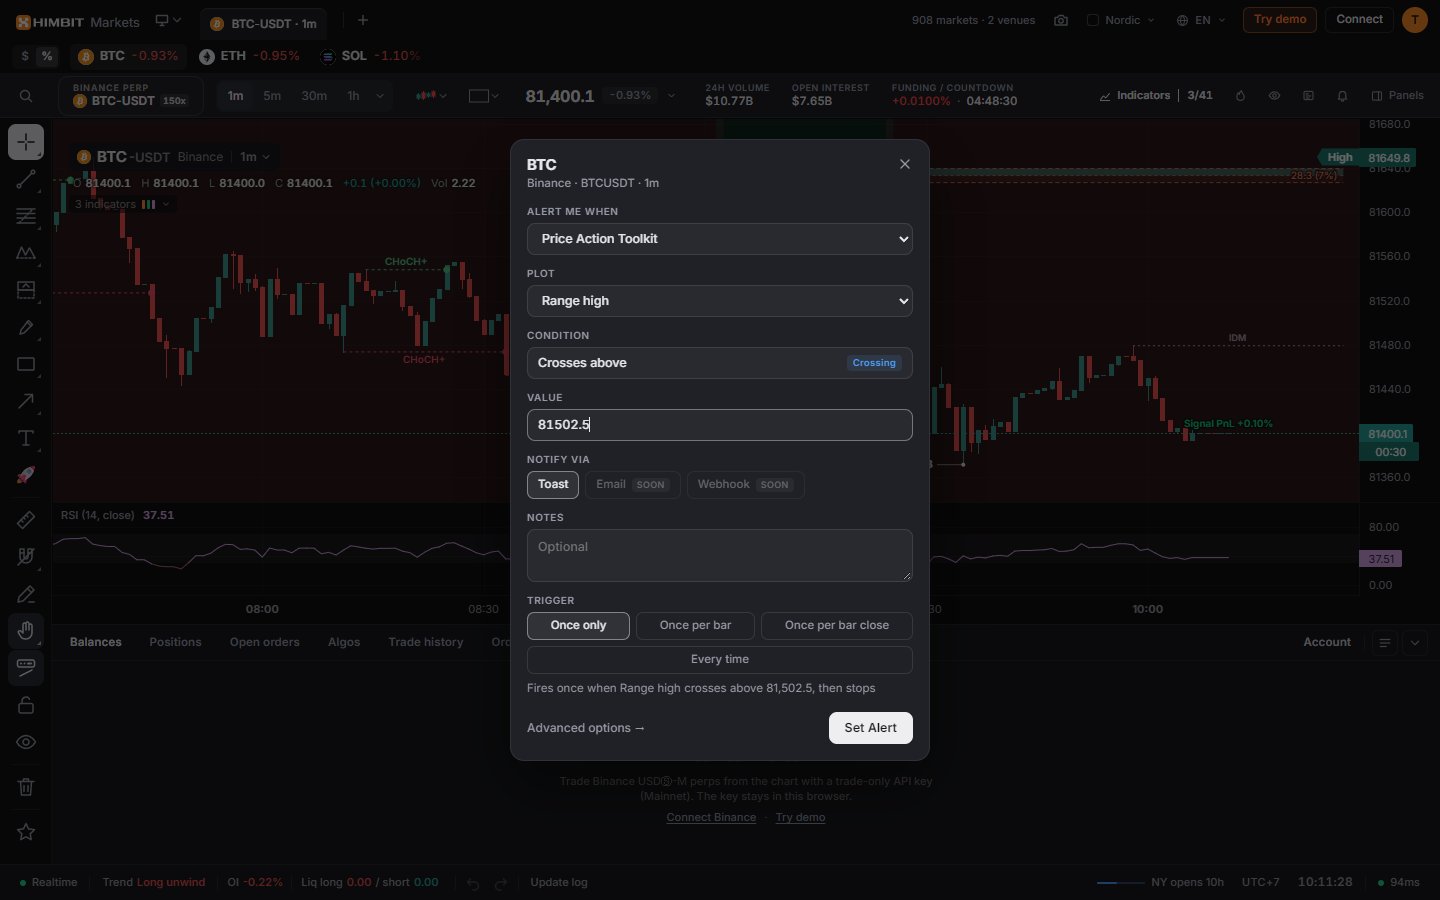
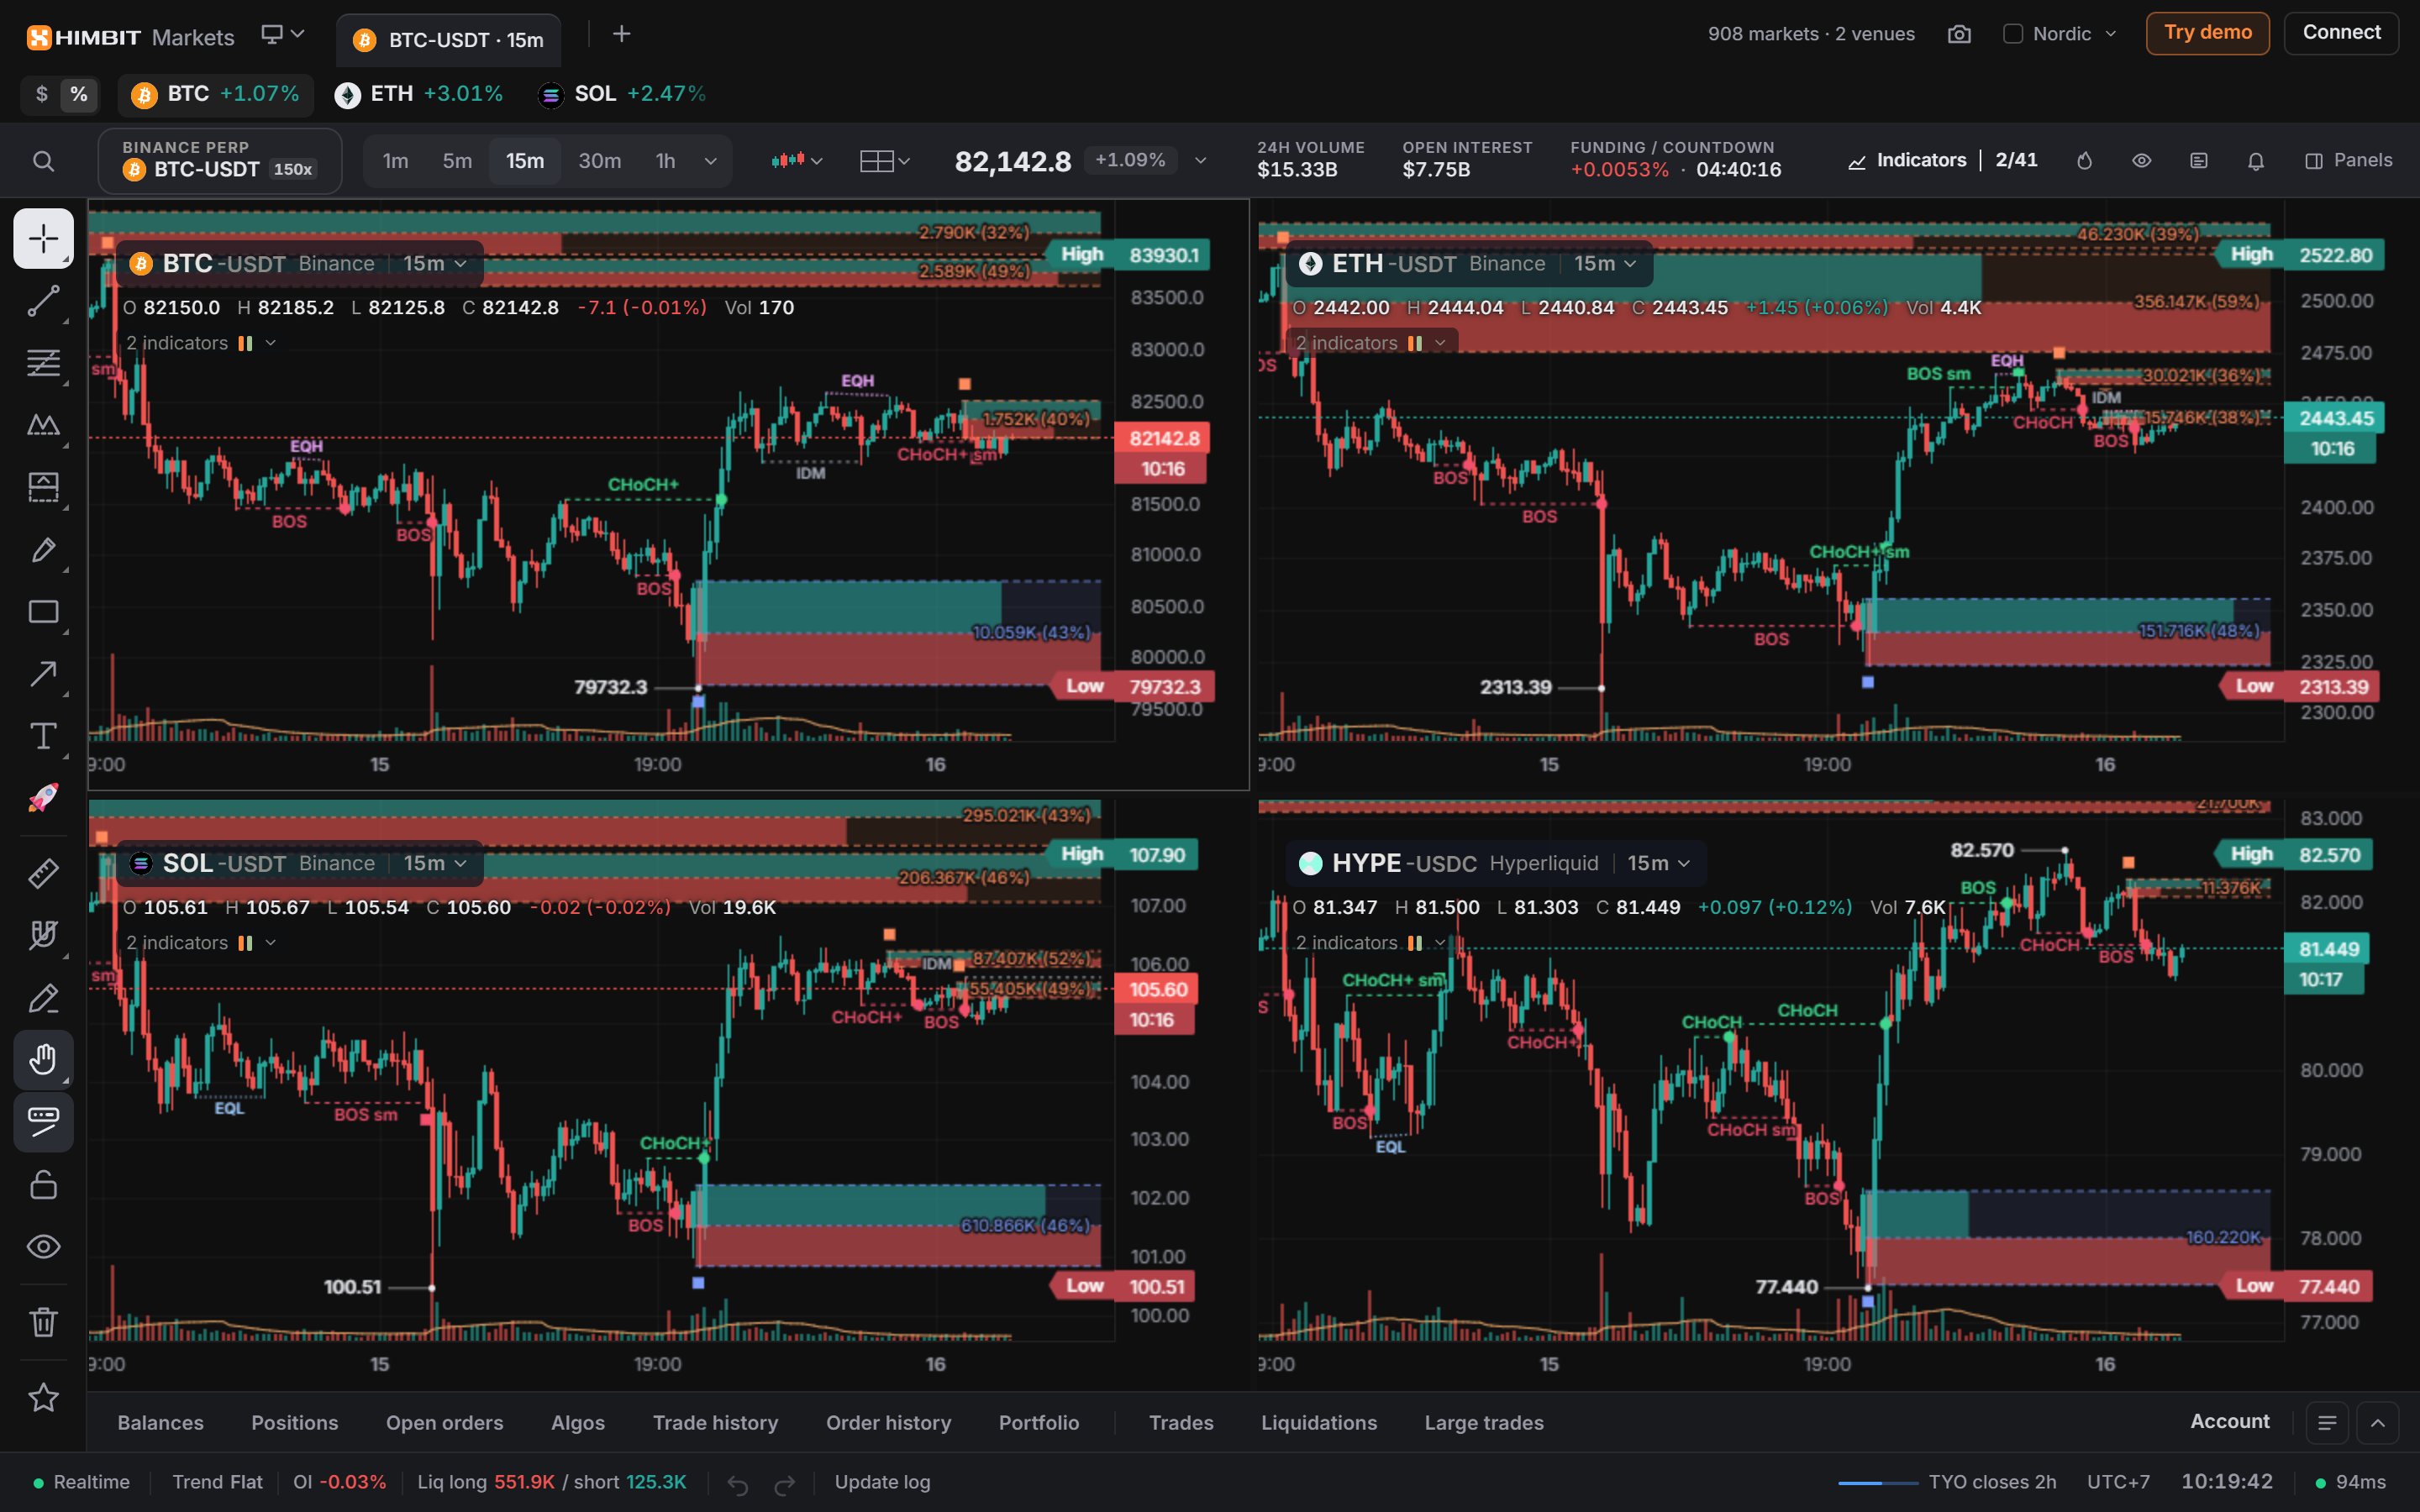
Everything you need to read a move, on one chart. See it, trade it, mark it, get pinged, and watch it all at once.
Learn to read the tape.
Free lessons on heatmaps, footprints, the DOM, VWAP and market structure. Each one ends with something to try on Market Open.
Open the Academy →Reading an Orderbook Heatmap
A heatmap shows where traders have parked limit orders over time, so you can watch liquidity build up, move and disappear instead of guessing from one frozen snapshot of the book.
Reading the DOM Price Ladder
The DOM is a vertical ladder of prices that shows, at every level near the market, how much is waiting to buy, how much is waiting to sell, and how much has actually traded there.
Footprint Charts: Looking Inside the Candle
A footprint splits each candle into its price levels and shows how much was bought and how much was sold at every one of them, so you can see who was pushing and where they ran out.
Your keys stay with you.
- Orders are signed in your browser. Himbit never holds your funds.
- Trade from a second device after both screens show the same 10-character code.
- Optional encrypted key backup, locked on your device. Himbit can't read it.
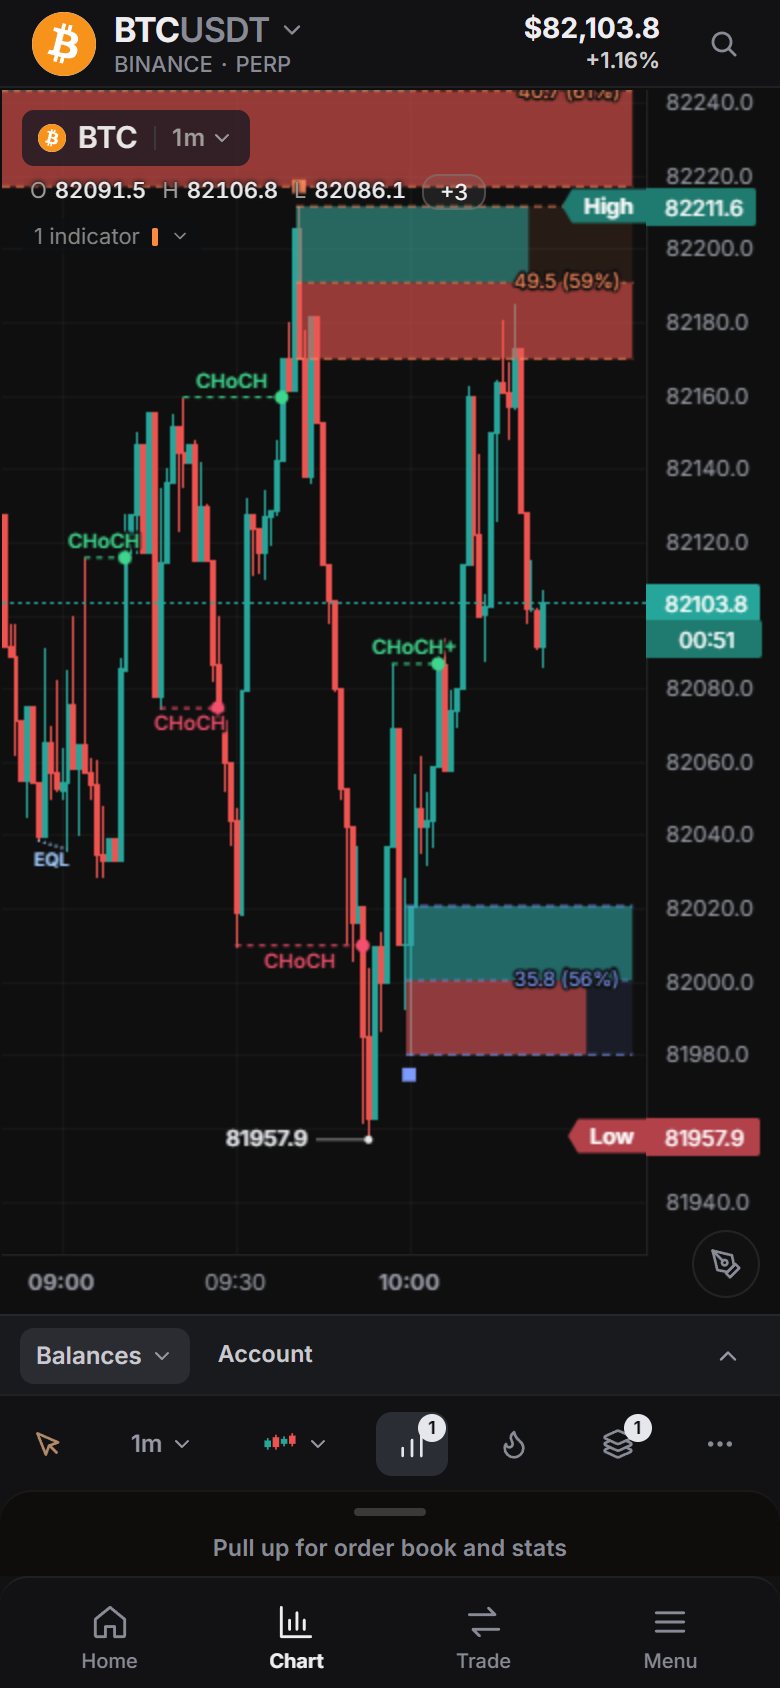
The market is already moving.
Open a chart and see where the size is sitting right now.
Open Market Open →