Himbit Academy
Learn to read what's behind the candles: resting liquidity, who is hitting whom, where structure breaks. Every lesson ends with something to try on Market Open.
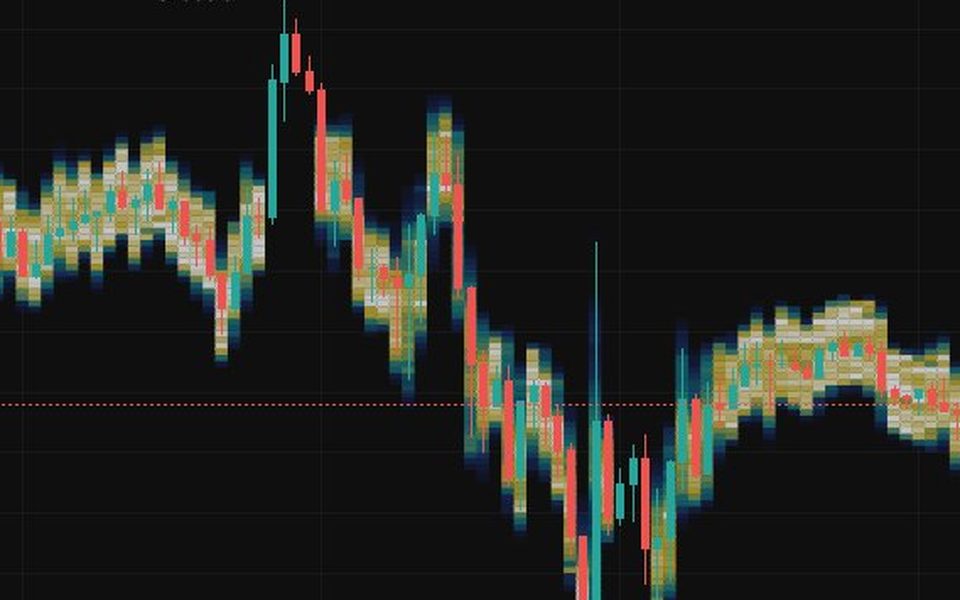
Reading an Orderbook Heatmap
A heatmap shows where traders have parked limit orders over time, so you can watch liquidity build up, move and disappear instead of guessing from one frozen snapshot of the book.
 Himbit Academy
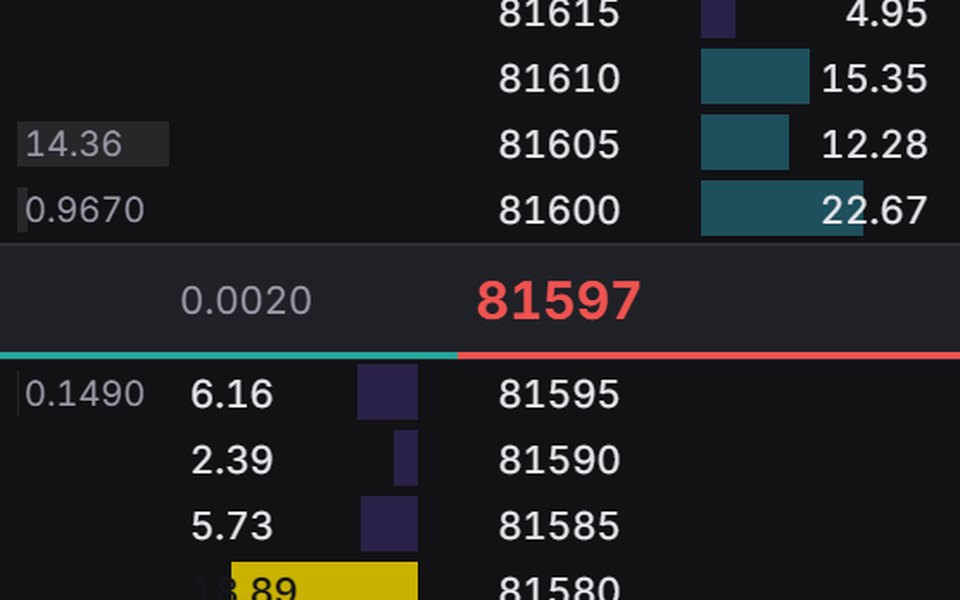
Reading the DOM Price Ladder
The DOM is a vertical ladder of prices that shows, at every level near the market, how much is waiting to buy, how much is waiting to sell, and how much has actually traded there.
Himbit Academy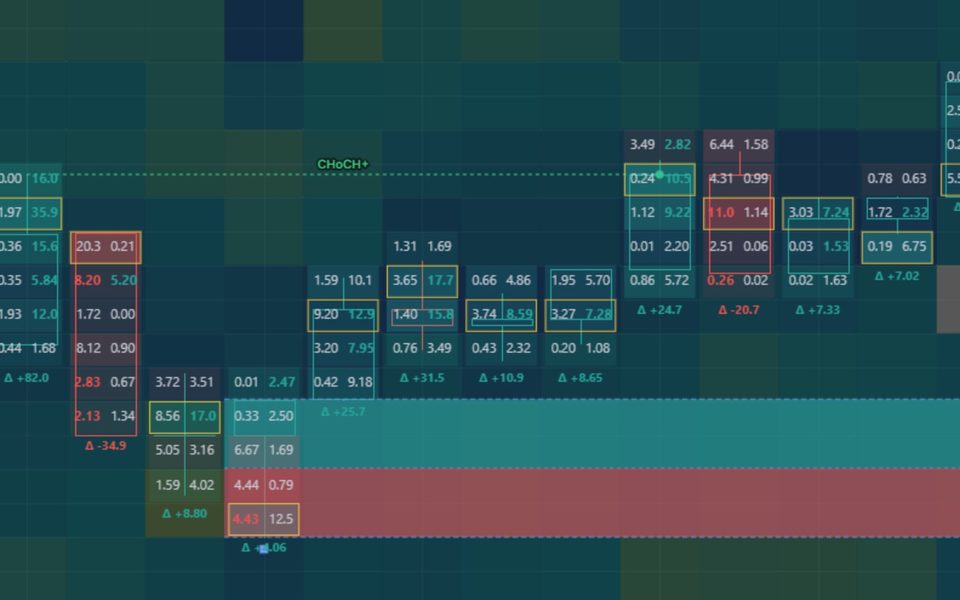
Footprint Charts: Looking Inside the Candle
A footprint splits each candle into its price levels and shows how much was bought and how much was sold at every one of them, so you can see who was pushing and where they ran out.
Himbit Academy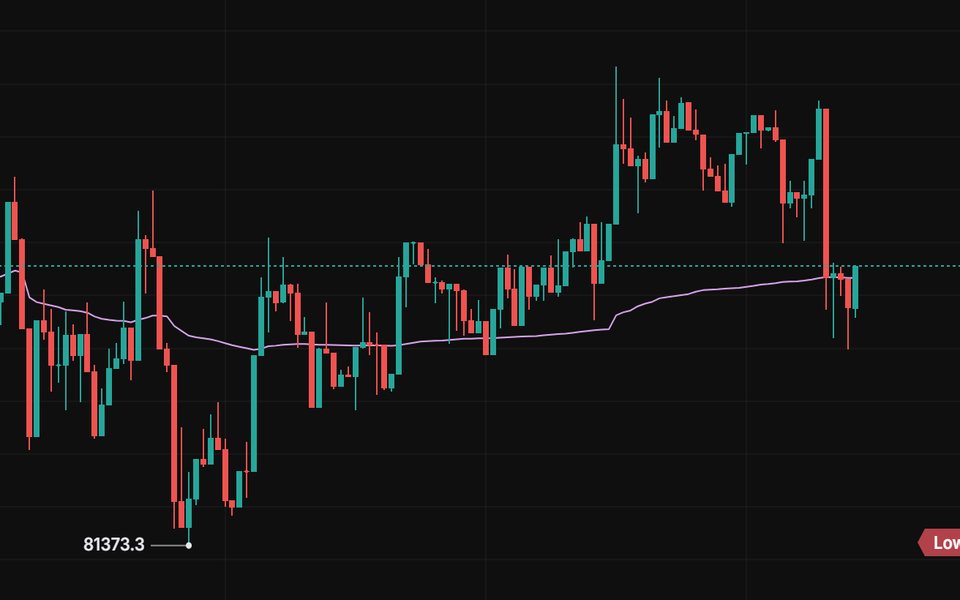
VWAP and Anchored VWAP in Practice
VWAP is the average price everyone paid since a starting point, weighted by how much they traded, and it is one of the simplest ways to tell whether buyers or sellers are in control of a session.
Himbit Academy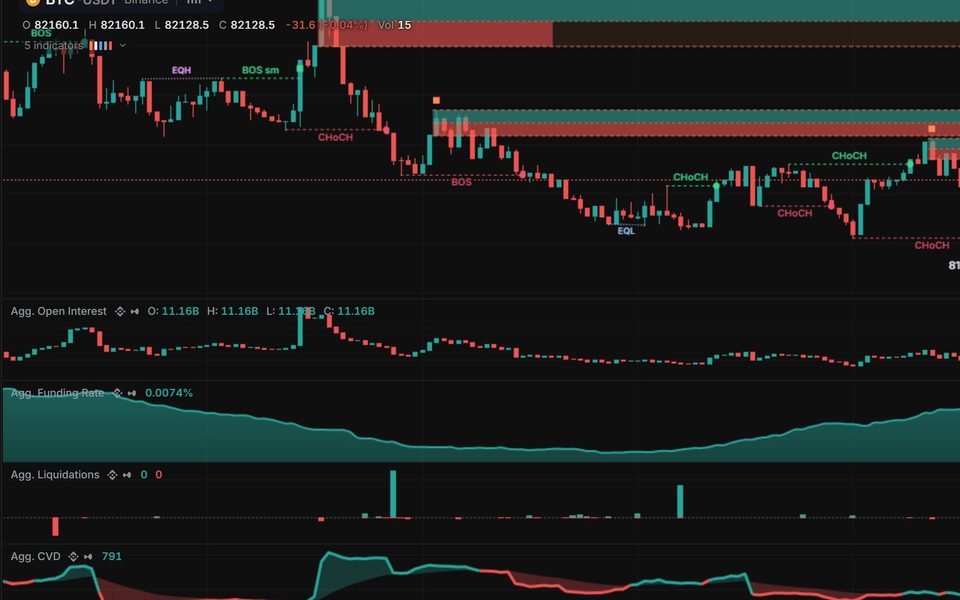
Open Interest, CVD, Funding and Liquidations
Price tells you where the market went, while open interest, CVD, funding and liquidations tell you who took it there and how crowded the trade has become.
Himbit Academy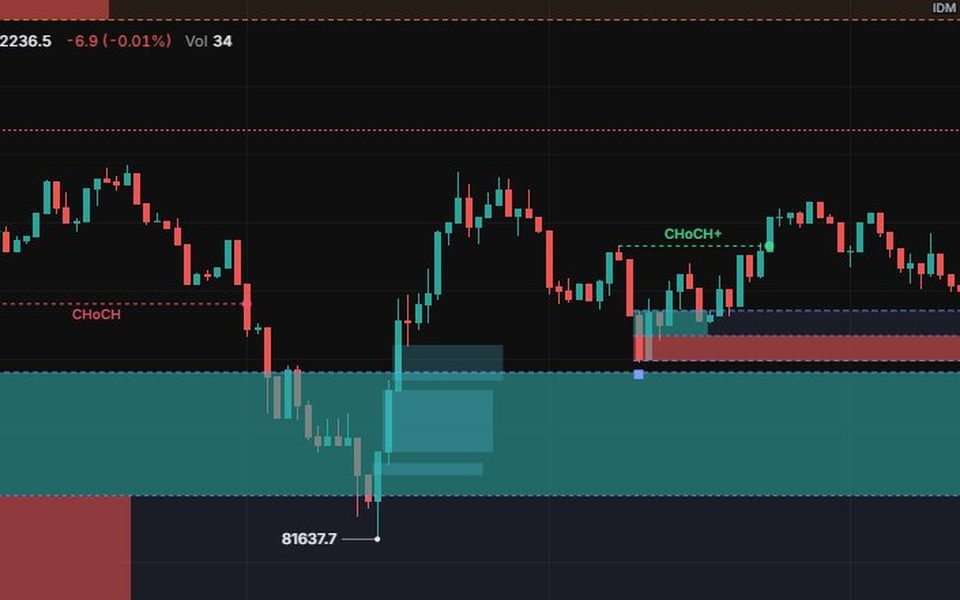
Market Structure the Smart-Money Way
Market structure is a way of reading trend from the sequence of swing highs and lows, and the smart-money vocabulary adds names for where trends break, where traders get trapped, and where price is likely to react.
Himbit AcademyDiscipline, Sizing and Tilt
Most trading damage is done in a handful of bad hours, so the goal of discipline is not perfect trades but keeping your worst days small enough that you can still think.
Himbit Academy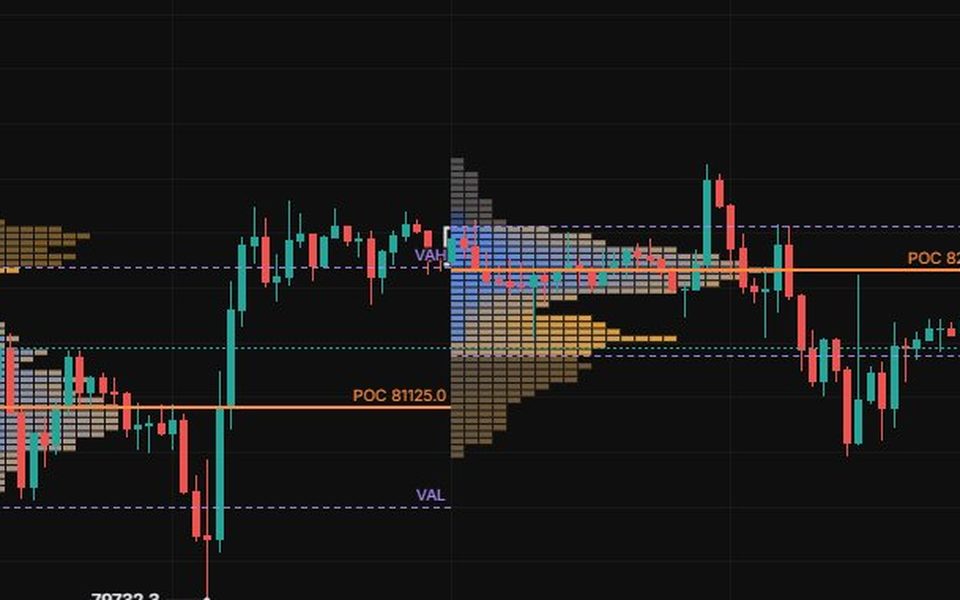
Reading a TPO Profile
A TPO profile turns a session on its side and shows how long price spent at each level, so you can see where the market found agreement, where it rushed past, and where the auction was left unfinished.
Himbit Academy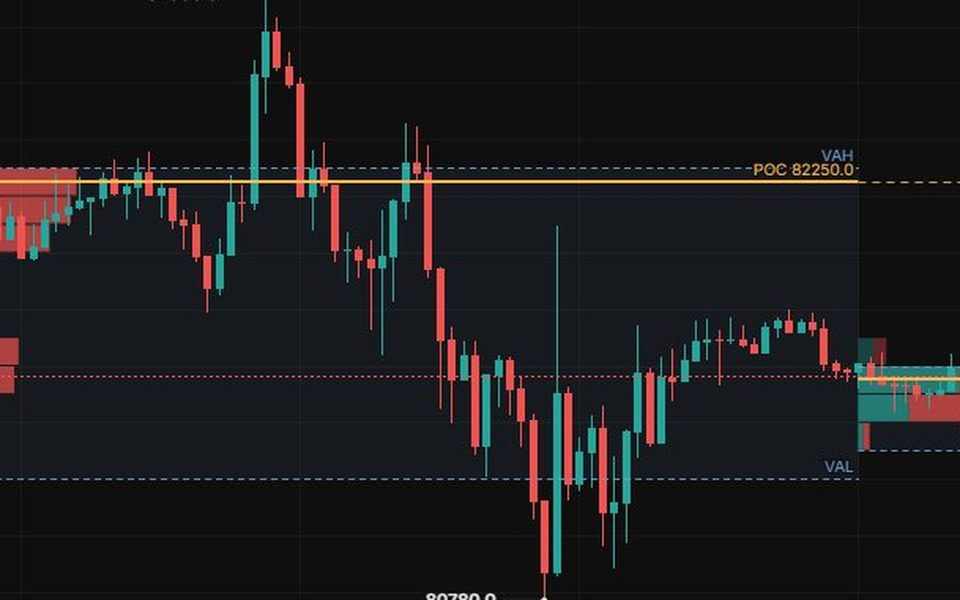
Volume Profile: Where the Money Traded
A volume profile is a histogram on the side of the chart that shows how much was traded at each price, which tells you where the market did serious business and where it barely stopped.
Himbit Academy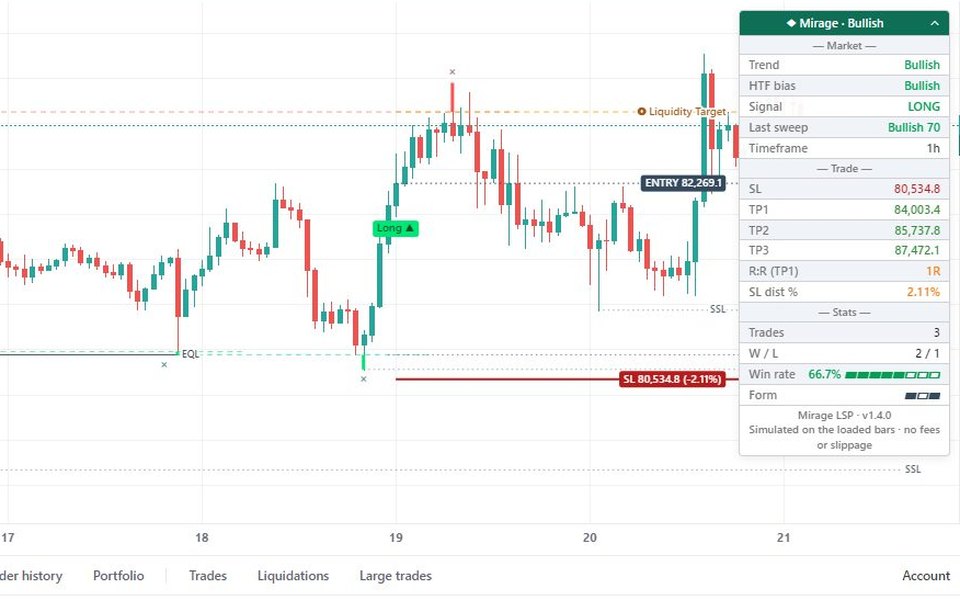
Trading Liquidity Sweeps with Mirage
Stops cluster above swing highs and below swing lows. When price runs those stops and snaps back, the move often turns. Mirage Liquidity Sweep Pro finds those moments, grades them and hands you a trade plan; this lesson
Himbit Academy