Reading a TPO Profile
A TPO profile turns a session on its side and shows how long price spent at each level, so you can see where the market found agreement, where it rushed past, and where the auction was left unfinished.
 Himbit Academy
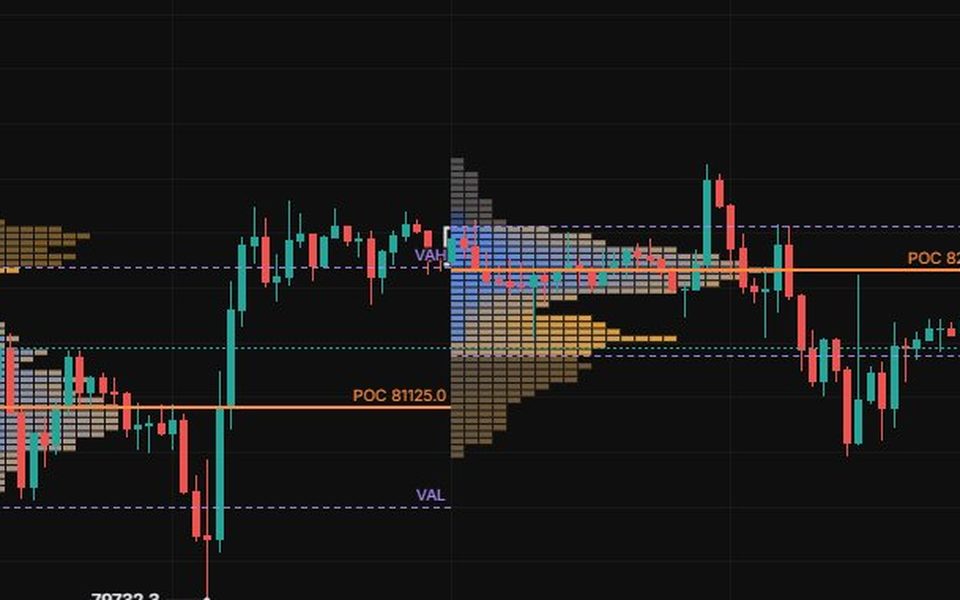
Time at price
TPO stands for time price opportunity. The session is cut into equal periods, say 30 minutes each. For every period, the profile marks each price row that traded during it. Stack those marks up and you get a sideways histogram of time: wide rows are prices the market kept coming back to, thin rows are prices it visited once and left.
In letter mode each period gets its own letter, so you can also read the order of events. The early letters tell you where the session opened and explored, the later ones where it ended up. In block mode the same marks are drawn as plain blocks, which is easier on the eye when you only care about the shape.
The shape is the point. A profile that bulges in the middle found a fair price and traded around it. A long thin one moved from price to price without agreeing on anything.
POC and the value area
The POC, point of control, is the row with the most TPOs: the price the session spent the most time at. Think of it as the session's centre of gravity.
The value area is the band around the POC that holds a set share of all TPOs, by convention about 70%. Its top is VAH, its bottom VAL. Inside the value area is where most of the session's business got done. Outside it, prices were tested and mostly rejected.
None of this needs volume. A quiet hour at a level counts the same as a busy one, which is why TPO pairs well with a volume profile over the same session.
Initial balance and extensions
The initial balance (IB) is the range of the first part of the session, traditionally the first two 30-minute periods. It is the opening offer: the rest of the session decides whether to accept that range or push beyond it.
When price trades outside the IB later in the session, that is a range extension. One small extension that gets pulled back in is normal. Extensions that keep going, period after period, tell you a bigger-timeframe trader has shown up and is moving price away from where the early traders put it. A rough measure is to project the IB range in multiples, 1.5x and 2x, and see how far the session travels.
Single prints
A single print is a stretch of rows touched by only one period. Price moved through those levels so fast that no other period came back to trade there. Single prints mark urgency: one side took control in a hurry.
Later they act as reference levels. If price comes back and moves through them easily, the urgency is gone. If it stalls at their edge, that side may still be around.
Poor highs and poor lows
A clean auction ends with a tail: a few rows at the extreme, touched by one period, where price probed and got rejected. A poor high is the opposite. The top of the profile is flat, with several periods stopping at roughly the same price and no tail above. It looks like price was capped rather than rejected. A poor low is the same thing at the bottom.
The usual reading is that the auction did not finish, and there may be stops and resting orders just beyond. Poor highs and poor lows tend to get revisited in later sessions. Not always, but often enough that traders keep them marked until they are cleaned up.
Balance and imbalance
Most sessions are balance sessions. Price stays near the IB, the profile builds a fat middle, edges get sold and bought, and the POC acts like a magnet.
An imbalance session looks different. The IB breaks early, extensions keep coming, single prints appear, and the POC keeps moving in the direction of travel. The profile is long and thin. Fading the edges on those days is expensive. Telling the two apart by the third period saves more money than any entry pattern.
Using yesterday's value for today
Where a new session opens relative to the previous session's value area sets up the day.
- Open inside yesterday's value. The market is still comfortable with yesterday's prices. Expect rotation inside the range unless something changes.
- Open outside value and stay out. Yesterday's fair price is being rejected. If the first periods hold above VAH, or below VAL, the market may be looking for a new value area, and selling strength or buying weakness gets risky.
- Open outside value and come back in. The move outside was not accepted. An old rule of thumb says that if price gets back inside value and holds there for two periods, it often travels to the other side of the value area.
A worked example
Say BTC finished yesterday's Daily (UTC) session with a POC at 99,500, VAH at 100,100 and VAL at 98,800, and a poor high around 100,450 where four periods stopped within a few points of each other.
Today opens at 99,700, inside value. The first two 30-minute periods set an IB from 99,250 to 99,950. The starting assumption is balance: rotation between yesterday's VAL and VAH, around 99,500.
In the fifth period price breaks above the IB and runs to 100,200, above yesterday's VAH, leaving a short run of single prints between 100,000 and 100,150. Now there are two questions. Will price accept above 100,100, meaning several periods build there? And will it reach the poor high at 100,450?
If the next two periods hold above 100,100 and the profile starts to widen up there, value is migrating higher, and the poor high becomes a reasonable target. If instead price drops back under 100,100 and through the single prints, the break was not accepted, and a move back toward 99,500 is the more likely path. Either way the profile gave you levels and a condition to watch, not a prediction.
Honest limits
TPO counts time, not size. A slow overnight drift can build a fat value area that very little money cared about. Session choice matters too: a Daily (UTC) profile, a New York profile and a London profile of the same day can look quite different. Pick the one that matches when you trade and stay with it. For the volume side of the same picture, see the Volume Profile lesson, and for what happens inside each candle at those levels, the footprint lesson.
Try it on Market Open
- Open BTC, go to Indicators, category Order flow, and add TPO Profile. Searching TPO or Market Profile finds it too. The settings are described on Chart tools.
- Set Period to 30m and Session to Daily (UTC). Under Levels, set Value area % to 70 and Initial balance to 2 periods, and turn on IB extensions, Single prints and Poor high/low.
- Under Style, keep POC, Value area and Initial balance on, and try Display Letters and then Blocks. On 15m with Row size on Auto you get blocks; set Row size to Ticks for letters. On 5m letters show by default.
- Note yesterday's POC, VAH and VAL. For the next five sessions, write down where each one opened relative to that value area and where it finished.
- Set Merge last N sessions to 3 and compare the merged value area with the single-session one.
- Add an alert on VAH, VAL, IB high or IB low so you hear about it when price reaches a level you care about.
- Before acting on any of this, practise it in the demo account via "Try demo".
Educational content, not investment advice. Leveraged trading can lose more than your margin.