Market Structure the Smart-Money Way
Market structure is a way of reading trend from the sequence of swing highs and lows, and the smart-money vocabulary adds names for where trends break, where traders get trapped, and where price is likely to react.
 Himbit Academy
Swings first
Everything starts with swings. A swing high is a peak with lower prices on both sides; a swing low is the reverse. Compare each new swing with the previous one of the same type and you get four labels:
- HH, higher high, and HL, higher low: an uptrend.
- LH, lower high, and LL, lower low: a downtrend.
A mix of these, such as a higher high followed by a lower low, means structure is unclear. Saying "no trend" out loud is a valid read and saves a lot of money.
Which swings count depends on your timeframe. A swing on the 1m chart may not even show on the 4h. Pick the timeframe you are trading and stay consistent.
BOS and CHoCH
A BOS, break of structure, happens when price closes beyond the last swing in the direction of the trend. In an uptrend, closing above the last HH is a BOS. It says the trend is continuing.
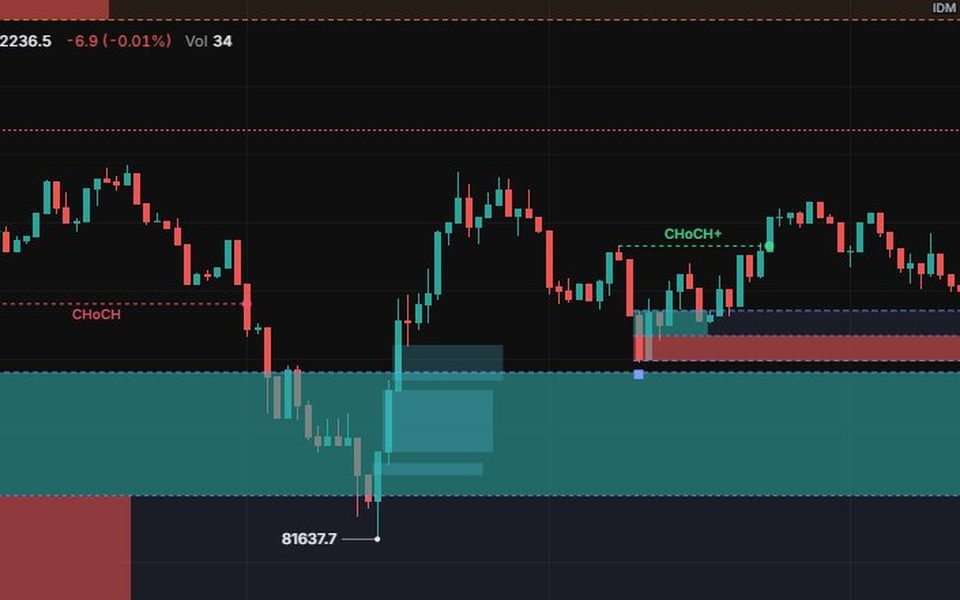
A CHoCH, change of character, is the first break against the trend. In an uptrend, the important level is the last HL, the low that the most recent push started from. If price closes below it, that is a CHoCH. It does not prove a reversal, but it says buyers failed to defend the level that mattered most.
The distinction is practical. After a BOS you look for pullbacks to join the trend. After a CHoCH you stop assuming the old trend and wait to see whether the other side can make a BOS of its own.
Inducement
IDM, inducement, is the first small pullback inside a new leg. It looks like a perfect entry, so early traders buy it and put their stops just under it. Price then often dips through that small low, takes out those stops, and only then reaches the deeper zone where the real reaction comes.
The lesson is about patience. If you can see an obvious little low that everyone will be watching, assume it may be swept before price turns. Many traders wait for IDM to be taken before they consider an entry at a deeper zone.
Order blocks
An order block is the last opposite-coloured candle before an impulsive move that broke structure. In an up move, it is the last red candle before the strong green push that made a BOS. The idea is that large buyers were filling there, and if price comes back to that area, unfilled interest may react again.
Order blocks fail often. They are most useful when they sit in the right place: inside the discount of an up leg, below swept inducement, and lined up with something else, such as a gap or a level.
Fair value gaps
An FVG is a three-candle pattern where the middle candle moves so fast that the high of the first candle and the low of the third do not overlap. That empty space is a price range where trading was one-sided. Price often returns to fill part or all of it. Some gaps get filled in minutes, some stay open for weeks, and some get blown through without a pause.
Premium and discount
Take the current leg, from the swing low to the swing high, and split it in half. Above the midpoint is premium, below is discount. Example: BTC rallies from 96,000 to 102,000. The midpoint is 99,000. In an uptrend you would rather buy in discount, under 99,000, than chase in premium near 102,000. In a downtrend you would rather sell in premium.
This is a filter, not a signal. It stops you from buying the top of a leg just because an order block happens to be there.
Honest limits
These definitions vary between traders, and any tool that labels them does so mechanically. In choppy markets CHoCH and BOS can flip back and forth every few candles. Most zones you draw will not produce a clean reaction. The framework is useful because it gives you a consistent way to describe the chart, not because the zones are magic.
Try it on Market Open
- Open BTC on the 15m chart and add the Price Action Toolkit. Turn on the swing labels, BOS/CHoCH, IDM, order blocks and FVG.
- Turn on the optional Summary card and read the bias, last BOS/CHoCH, nearest zone above and below, and whether price sits in premium or discount.
- Use Bar Replay, stop before each new break, and write down whether you expect a BOS or a CHoCH next.
- Add an alert on a Price Action signal for a market you follow. Alerts only fire while Market Open is open in your browser.
Educational content, not investment advice. Leveraged trading can lose more than your margin.