Wyckoff Range Engine: Trading Accumulation and Distribution
Richard Wyckoff drew these schematics about a hundred years ago. On TradingView, the scripts that draw them for you tend to sit behind a paid plan, an invite-only request and a DM to someone selling access. In Himbit Markets, Wyckoff Range Engine is in the indicator list, free, on every market and timeframe. Fair enough: Wyckoff never charged per chart either.
 Himbit Academy
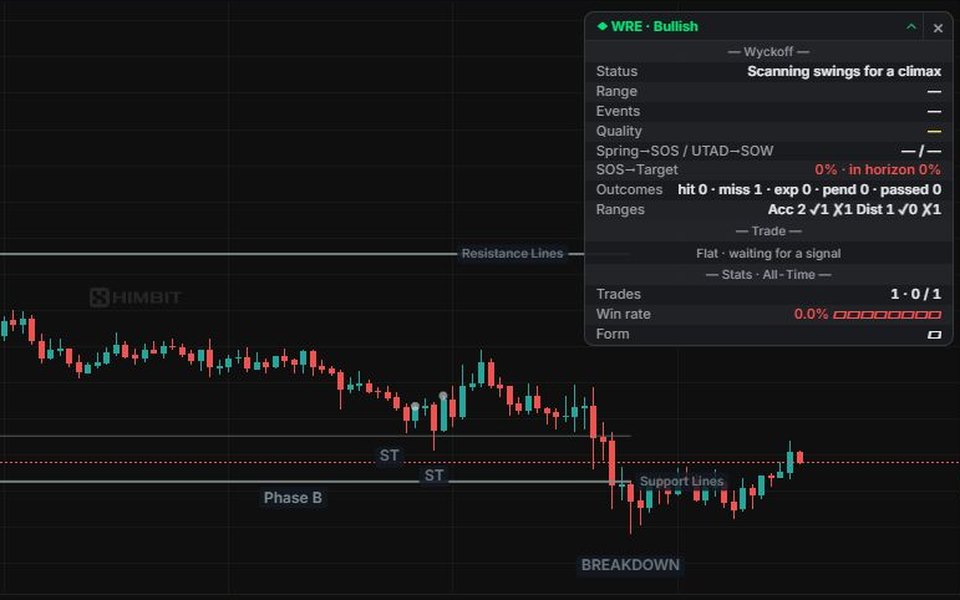
The idea in one paragraph
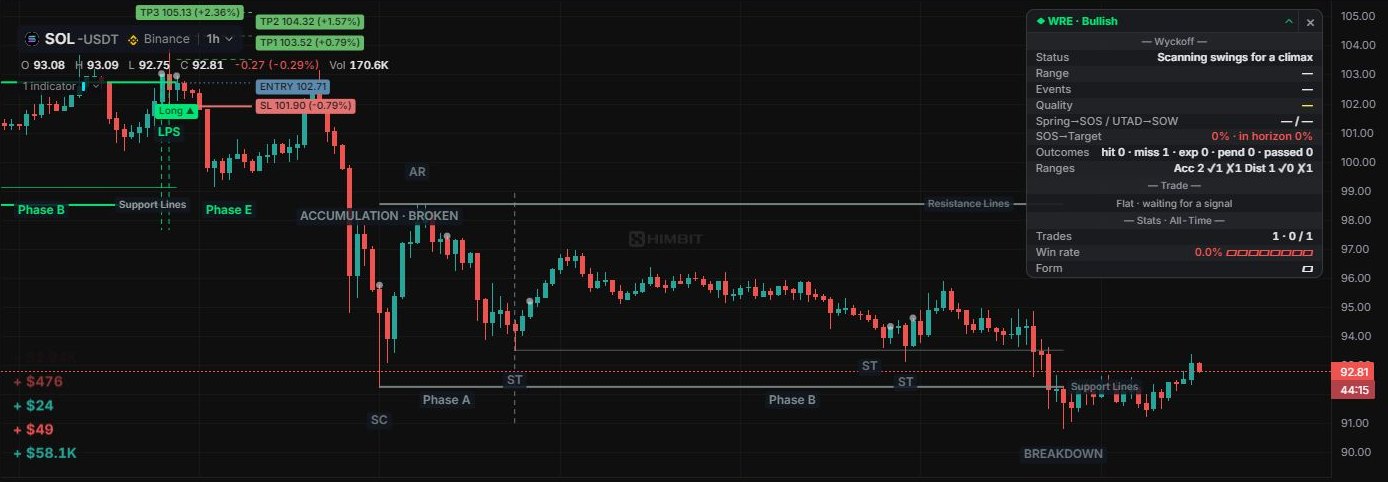
Big players can't buy or sell everything at once. They build a position inside a range, and the range leaves the same footprints each time: a climax, a reaction, a few tests, a shakeout, a breakout and a last pullback. Wyckoff Range Engine finds those footprints on its own, from closed candles only. An event appears when its candle closes and is never redrawn.
The events
| Event | Accumulation (bullish) | Distribution (bearish) |
|---|---|---|
| Climax | SC, selling climax: a heavy, fast drop with effort | BC, buying climax |
| Reaction | AR, automatic rally: sets the top of the range | AR, automatic reaction: sets the bottom |
| Tests | ST, secondary tests back near the climax | ST |
| Shakeout | Spring: pokes under the floor and snaps back | UTAD: pokes above the ceiling and fails |
| Confirmation | Test of the Spring | Test of the UTAD |
| Breakout | SOS, sign of strength, with effort | SOW, sign of weakness |
| Entry | LPS, last point of support: the first pullback that holds | LPSY, last point of supply |
Hover any label to see its numbers, for example Selling Climax · 68/100 · peak effort ×2.4 · run 5.1 ATR. A score is a rating out of 100, not a probability.
Phases A to E
The phase dividers split each range into five parts:
- A, stopping the trend: the climax, the AR and the first ST.
- B, building the cause: more tests inside the range.
- C, the shakeout: the Spring or the UTAD.
- D, the breakout (SOS or SOW) and the LPS or LPSY.
- E, the trend leaving the range.
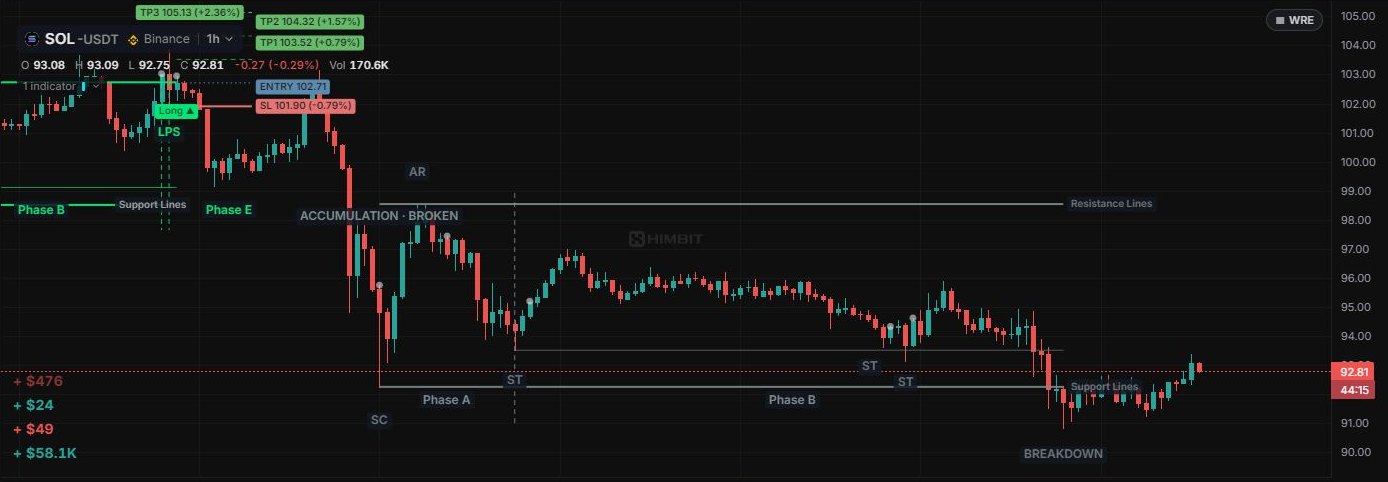
Accumulation ranges are drawn green and distribution ranges red, each with its Support Lines and Resistance Lines. After a breakout, a dashed Target line shows the measured move: one range height past the edge.
A range can also fail: price closes decisively past the climax edge, doesn't come back in time, or loses the breakout before the LPS. The failure is marked (BREAKDOWN, BREAKOUT), and the range title ends in BROKEN or BREAKOUT LOST. A run that never stopped is tagged NO RANGE · trend. Failed ranges stay on the chart in gray, so you can see what didn't work.
How to trade it
- Wait for a range. No climax, no trade. If the market is just trending, let it go.
- Let the range prove itself. The card's Events row ticks off SC or BC, AR, the number of STs, Spring, Test and SOS as they happen. Quality scores the climax, the Spring and the breakout from 0 to 100. Higher scores mean a cleaner range.
- Enter on the LPS or LPSY. That's the default entry: after the breakout, on the first pullback that holds above the old ceiling (or below the old floor). The indicator draws ENTRY, the stop and TP1, TP2, TP3, each with its distance in %.
- Manage the trade. After TP1 the stop moves to break-even. A signal the other way closes the trade and turns it around (Reversal).
- Respect a failure. A gray range, BROKEN or BREAKOUT LOST means the idea is over. There's an alert for that too.
The stop and the targets
The default stop is Wick-Anchored: 0.25 ATR(14) beyond the wick of the signal candle, and never closer than 0.5 ATR to the entry. The other SL mode choices are ATR, a multiple of ATR set by the risk preset, and Structure, just beyond the event's own level.
Targets are in R, multiples of the risk between the entry and the stop:
| Risk preset | Stop in ATR mode | TP1 | TP2 | TP3 |
|---|---|---|---|---|
| Conservative | 2.5 | 1R | 2R | 4R |
| Balanced (default) | 1.5 | 1R | 2R | 3R |
| Aggressive | 1.0 | 1.5R | 2.5R | 4R |
| Scalping | 0.8 | 0.8R | 1.5R | 2R |
| Custom | your value | your values, with TP1 < TP2 < TP3 |
Break-even after TP1 is on, with no offset. Other entries are available under Trade entry signal: Spring / UTAD, SOS / SOW, or Spring + LPS.
The card
A small card sits in the top-right corner of the price pane, titled WRE with the current bias. It has three sections on by default:
- Wyckoff: Status, Range, Events, Quality, how often a Spring led to an SOS (and a UTAD to an SOW), how often an SOS reached its target, and how past ranges ended.
- Trade: the open position with its entry and stop, or Flat · waiting for a signal.
- Stats: Trades, Win rate and Form, your last results, over the whole history by default.
The Market section is off by default. On a phone the card shows a short version: Status, Position, Last signal and Win rate.
▴ folds the card to its title line. × closes it and leaves a small ▦ WRE chip in the corner; tap the chip to bring the card back. The card remembers its state on this device, and on a phone it starts folded.
Default settings
Detection
- Effort source Auto, effort baseline 50 bars, ATR period 14.
- Climax: score at least 60, peak bar effort at least 2.0 × the baseline, and at least 2 swings of trend before it.
- Swing reversal 1.0 ATR. The AR must take back at least half of the climactic run, within 60 bars.
- Range height between 3 and 8 ATR, and at most 400 bars long.
- ST zone 0.3 of the range height, up to 3 STs per range, and a Spring needs an ST before it. Test zone 0.4.
- Failure: a close 0.5 ATR past the climax edge. A false break must be reclaimed within 8 bars.
- SOS / SOW: leg effort at least 1.2 × the baseline or a leg of at least 1.5 ATR, with a close 0.1 ATR past the range.
- LPS / LPSY: a pullback that stays in the top quarter of the range (bottom quarter for an LPSY), within 60 bars of the breakout.
- Target: 1 range height past the edge, drawn 40 bars long. A breakout is judged over 120 bars. The target must sit at least 0.5 ATR ahead of the SOS close.
Display
- Range lines, phase dividers, event labels, Long / Short labels, the target, detection markers and failed ranges are on. Swing points are off. The last 4 ranges stay on the chart.
All of these live in the indicator's settings under Inputs, Risk and Style. A setting that can't work, such as TP1 above TP2, shows Settings error on the card with the reason.
Timeframes and markets
It works on any market and timeframe. Ranges need room to form, so 15m to 4h on liquid markets reads best. On 1m to 5m, noise makes many climaxes that never turn into ranges. On the daily you get few ranges, and they take a long time.
Alerts
Right-click the chart and pick Add alert on Wyckoff Range Engine. You can be told about a Long entry or Short entry, each event (SC, BC, AR, ST, Spring, UTAD, Test, SOS, SOW, LPS, LPSY), Range failed, TP1 to TP3, the stop moving to break-even, the stop being hit, a break-even stop and a Reversal. On Binance and Hyperliquid from 1m to 4h these alerts reach your lock screen with the app closed, like the other indicator alerts. See Alerts.
Honest notes
- Closed candles only: nothing is drawn on a candle that is still open, and nothing is redrawn later.
- The win rate and the other stats are simulated on the bars loaded in the chart, with no fees or slippage. They describe the past.
- Wyckoff is a way to read intent, not a promise. Keep your size small and let the stop do its job.